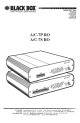
Black Box кабельная коробка A/C-7P RO Руководство
PDF Руководства
149 Страницы
Английский
PDF Руководства
149 Страницы
Английский


manualsocean.ru - это единая платформа для онлайн-руководств. Вы можете легко найти и просмотреть пользовательские руководства онлайн. В нашей базе данных более 600 000 PDF-руководств. Мы каждый день собираем и добавляем новые пользовательские руководства, чтобы вы могли найти подходящее руководство для своего поиска. Вы можете бесплатно просматривать все онлайн-руководства.


 England
  Deutschland
  France
  Italia
  Polska
  United Kingdom
  Россия
  Nederland
  España
  Magyarország
  Sverige
  România
  Portugal
  Colombia
  Suomi
Suomi  New Zealand
  Česká republika
  Türkiye
  Danmark
  日本
日本